Lake Kachess Water Level
To learn about this website and the data,
see the Data Page
Quick Stats
| Description | Value |
|---|---|
| Last data date | Mon, 3/16/2026 |
| Feet down | -20.1 feet |
| Feet down (last season) |
-43.7 feet |
| Volume (acre feet) |
155,510 a.f. |
| Rank vs peers* (feet down) |
67.5% |
| Level change (1 day) |
+3.2 inches |
| Level change (last 7 days) |
+26.8 inches (2.2 feet) |
*Rank - 0% is most full of all dates. 50% is median. 100% is least full.
Kachess Lake Highest Level
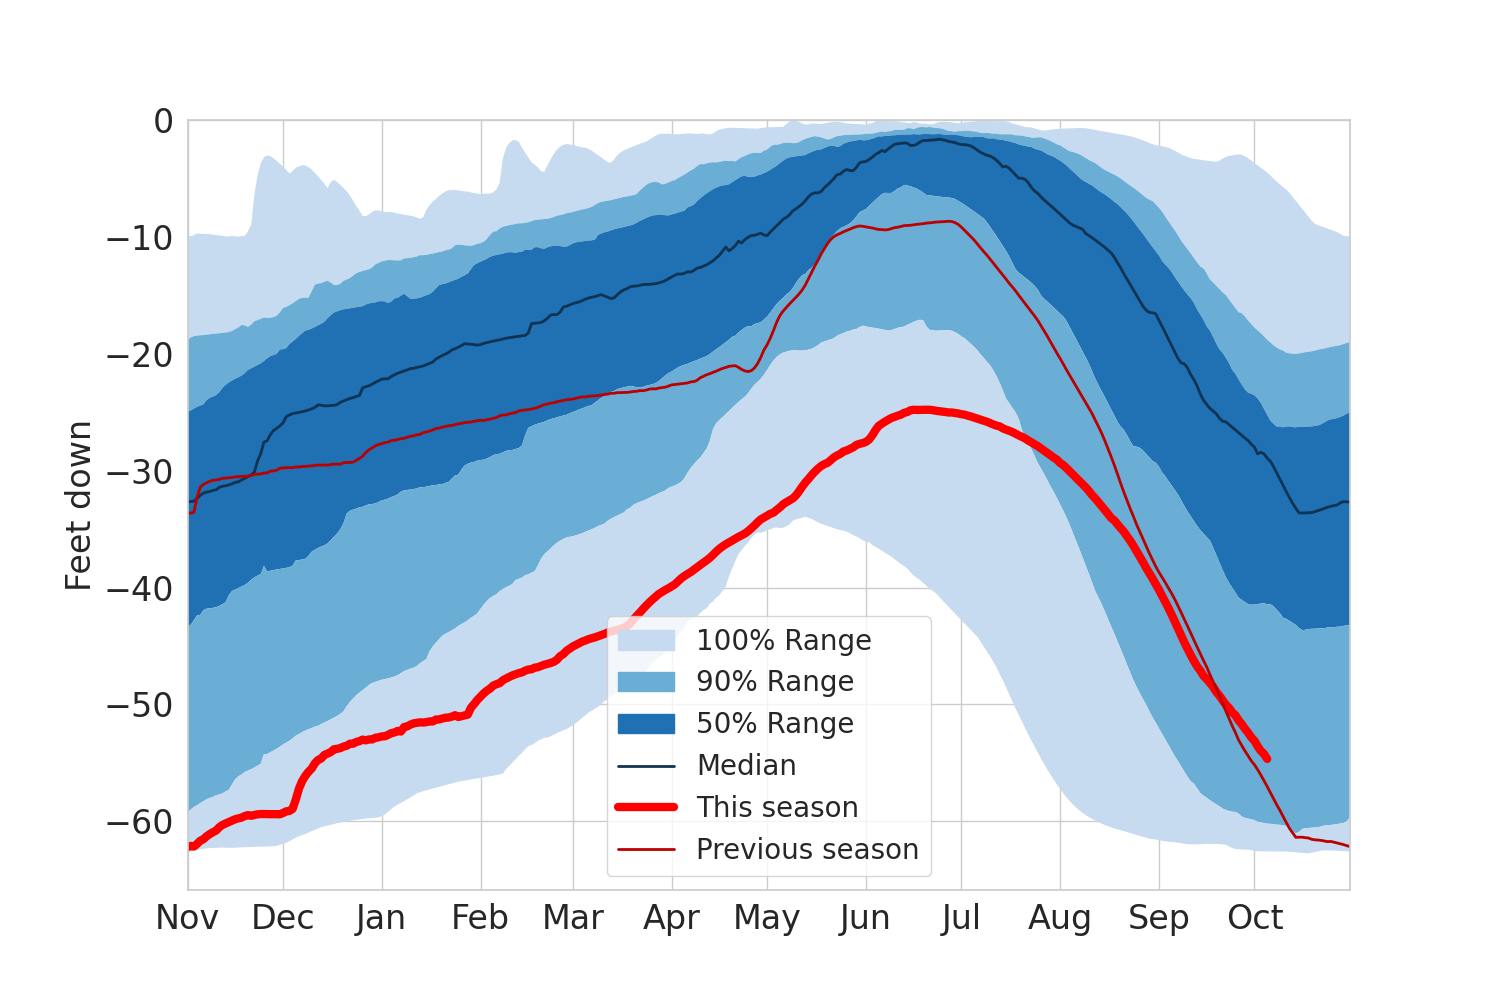
How to read this chart
- Feet Down - This is the number of feet the surface is down from the maximum fill level. So if the lake is totally full, the "feet down" is 0. And if the lake reaches it's most-emptied state, it would be about -61 feet down. (Based on my calculations.)
- This / Previous "Season" - The data is transformed to be from Nov to Oct. So one "season" might be Nov 2019 to Oct 2020. This is because the lake starts usually bottoms out at the end of a "season" in October.
- Confidence Intervals
- 100% - All measurements fall in this range. (So this is basically the min and max at each date.)
- 90% - 90% of all measurements fall in this range.
- 50% - 50% of all measurements fall in this range.
- Median - This is the median lake level. That means that 50% of the observations are above this value. And 50% are below.
- Time Period - 1950 to current.
How Good Is The Snowpack?
Snow Water Equivalent
How Much Precipitation This Year?
Water Year To Date Precipitation
How Fast Does The Lake Level Change?
28 Day Moving Average
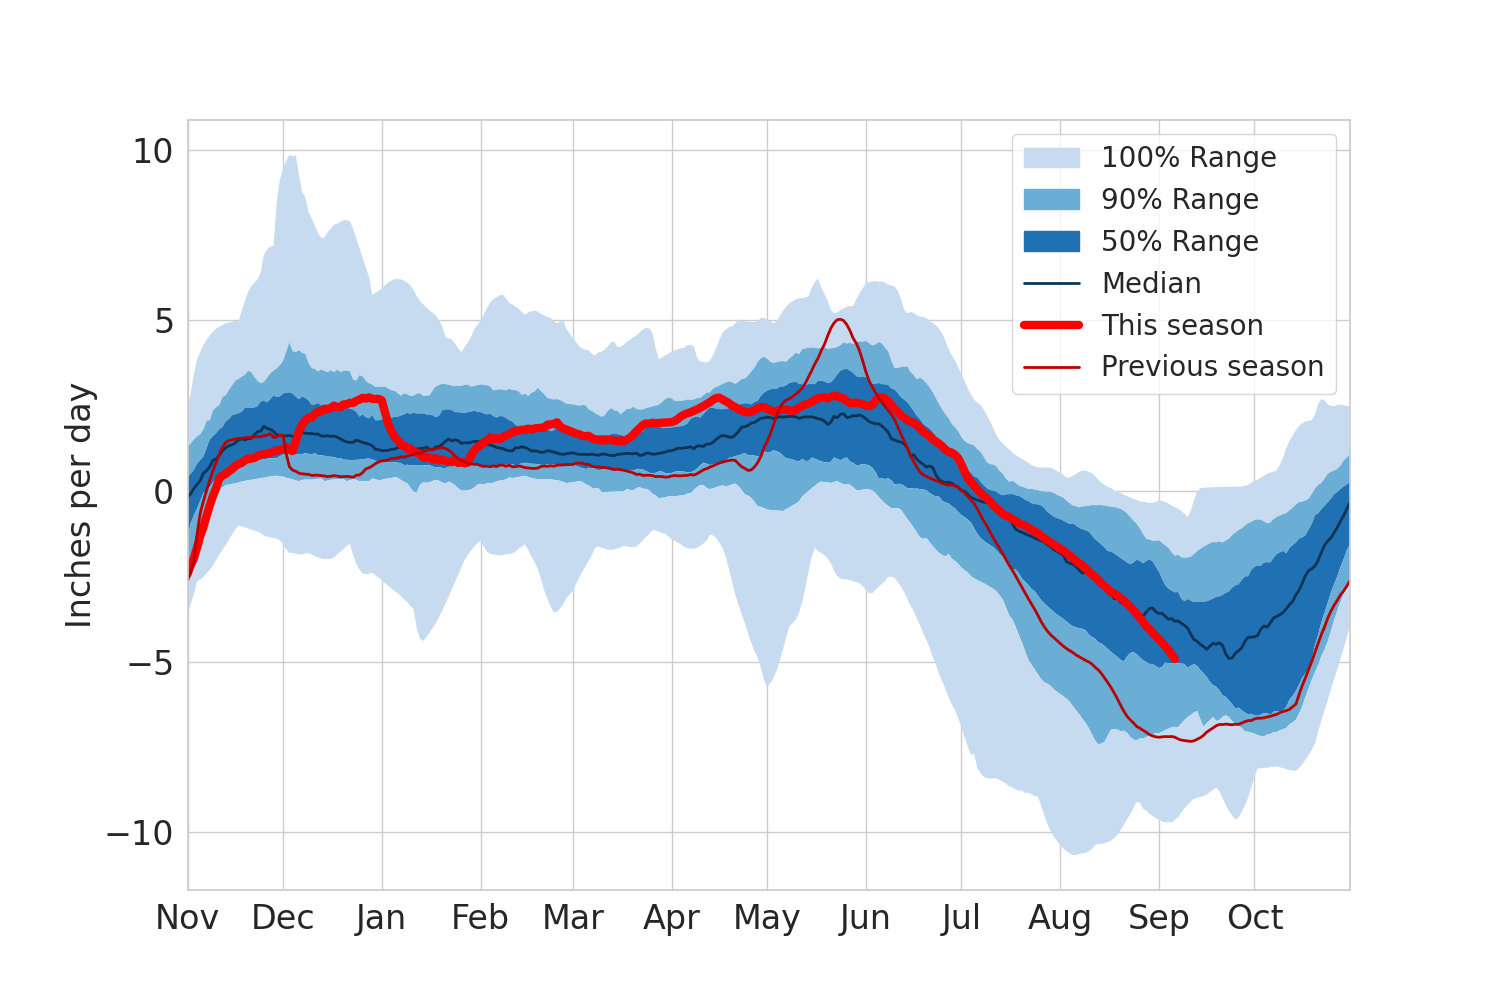
How to read this chart
This shows the how fast the lake level is changing (vertically) in inches per day, like the next chart. But here I calculate a 4 week moving average, which smooths out the curve.
This shows confidence intervals as well. See the note in the firt chart ("Highest Level") for an explanation.
How Fast Does The Lake Level Change?
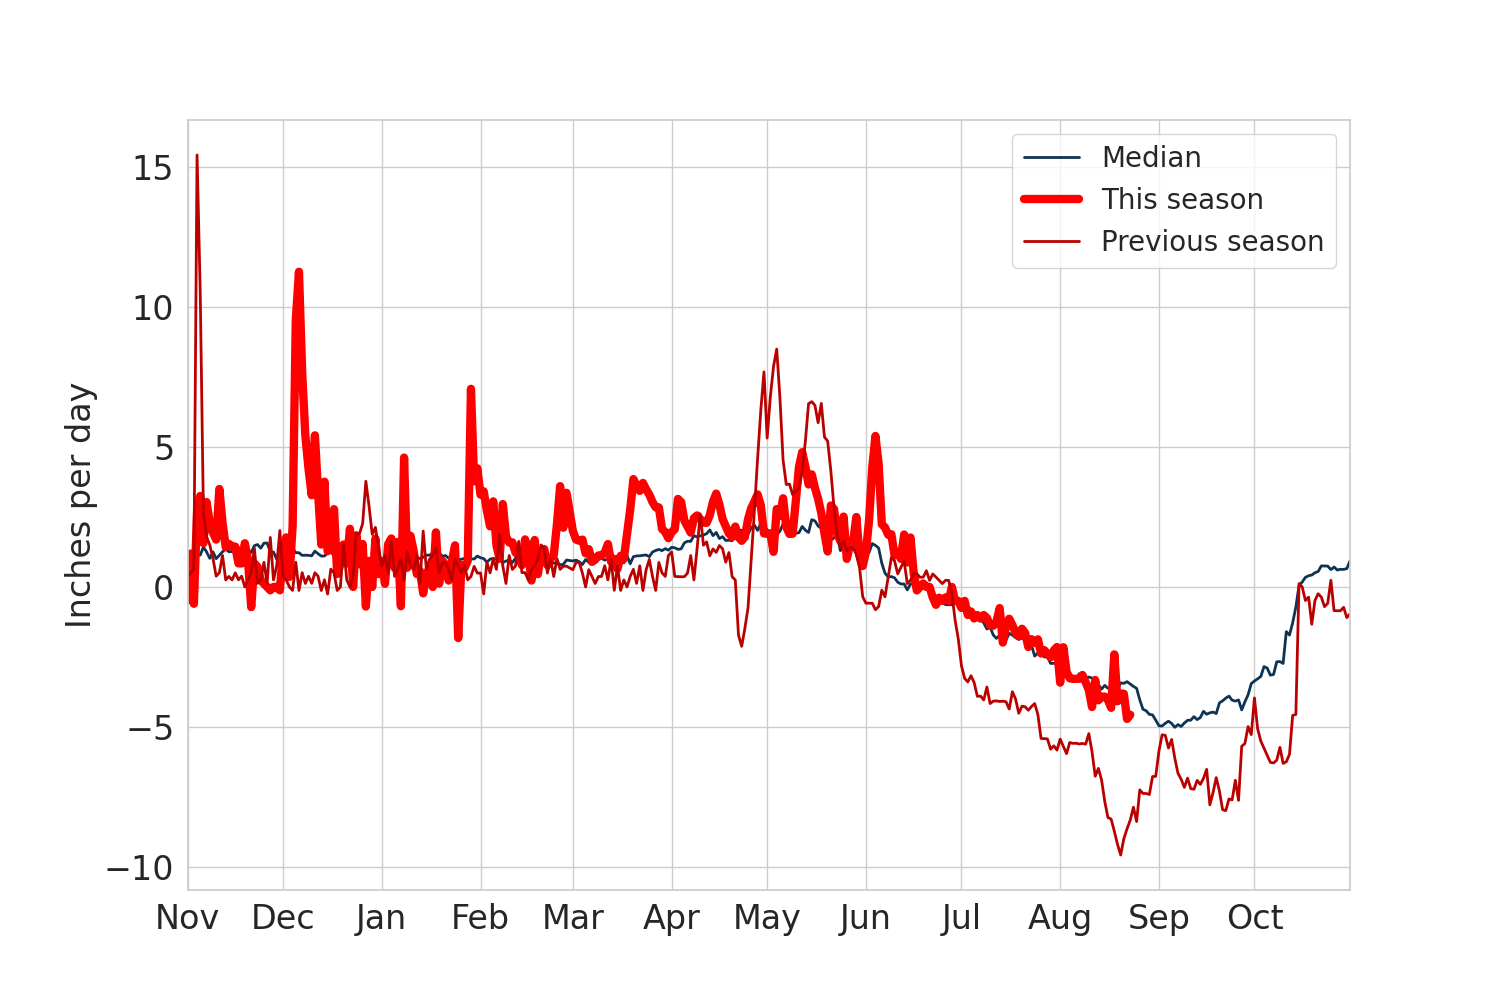
How to read this chart
This shows the how fast the lake level is changing (vertically) in inches per day.
I do not show confidence intervals for this chart because daily changes are so variable the ranges don't mean much. See the previous chart for better smoothing.