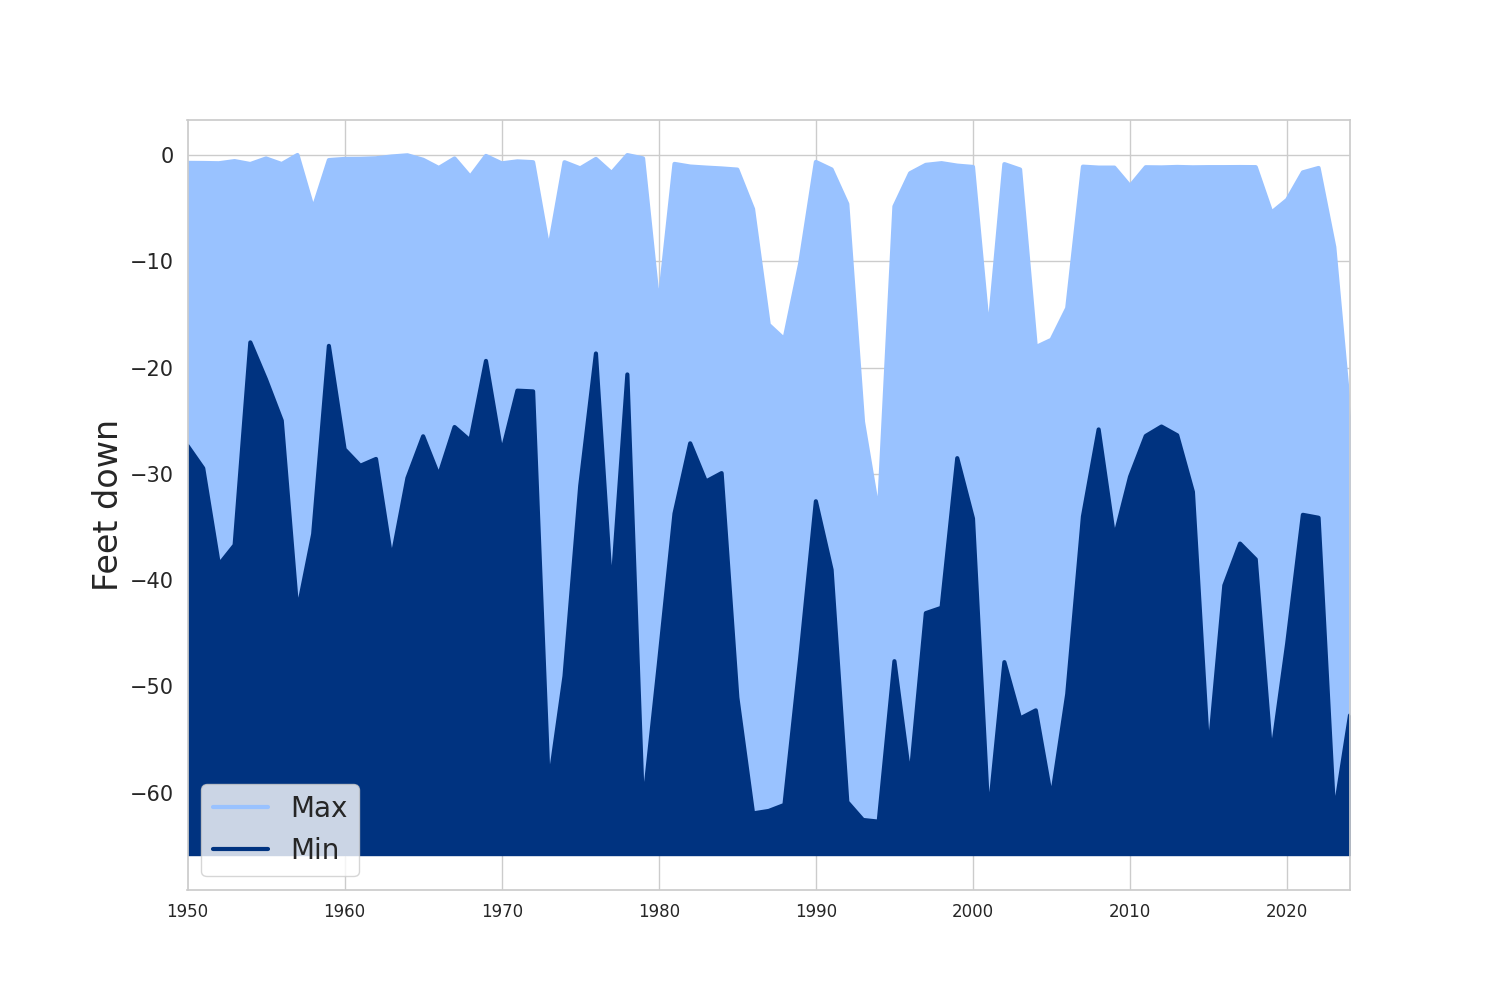
Lake Kachess Water Level
Minimum and Maximum Levels By Year
How to read this chart
- Max - This is the maximum lake fill level for a given year. So for instance in 1957, the lake was filled almost to the top.
- Min - This is the lowest point the lake gets to for a given year. So for instance in 1994 the lake got to its lowest level of -61 feet down.
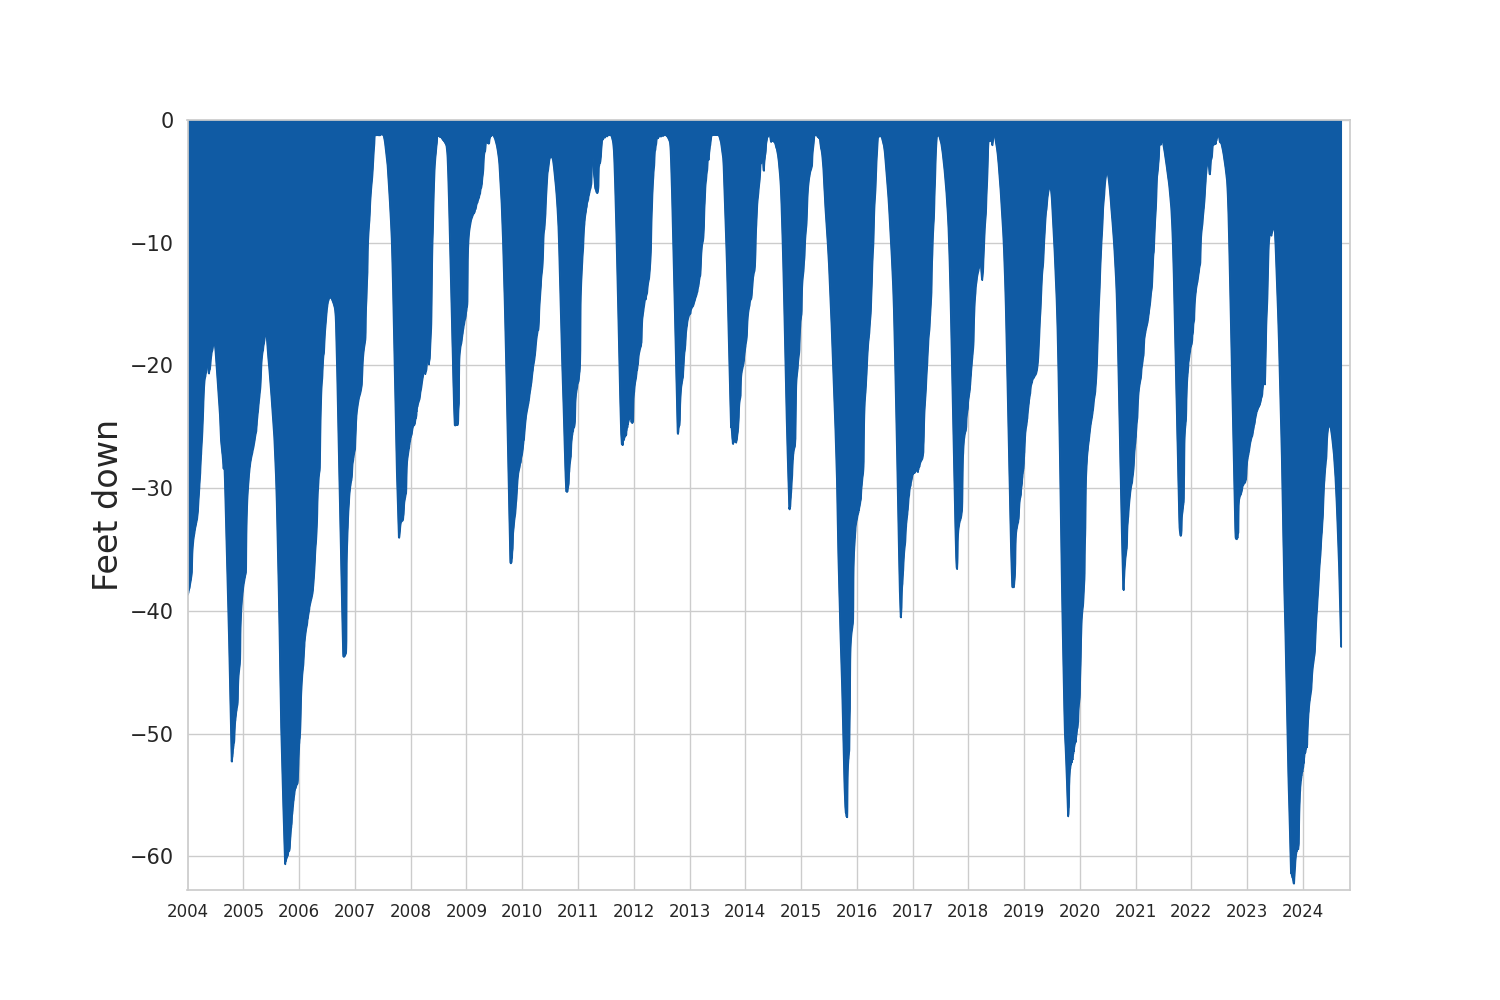
Surface Level - Last 20 Years
How to read this chart
- This shows the full data over the last 20 years.
- The longer the time period, the harder to read, so I'm limiting to 20 years.
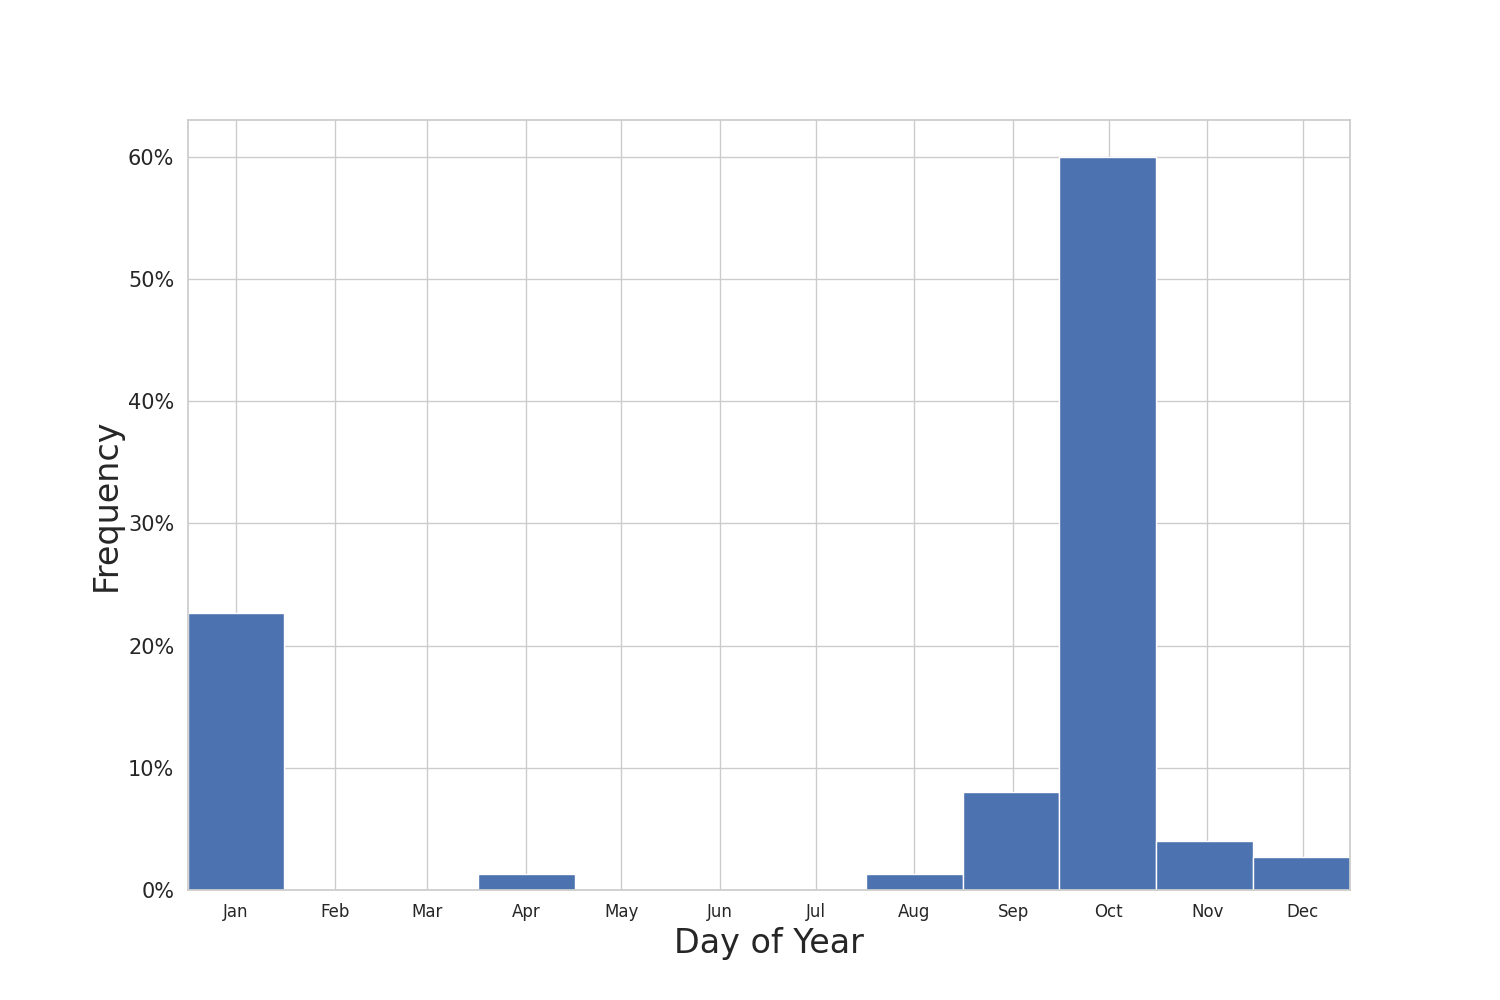
When Does Does It Bottom Out Each Year?
How to read this chart
- This is a histogram showing when the lake reaches its lowest level each year.
- October is generally the low point for the year, after the summer drawdown, and before the winter rains.
- When you see January, that probably means that last year's lowpoint is lower than the normal October drawdown low for the current year.
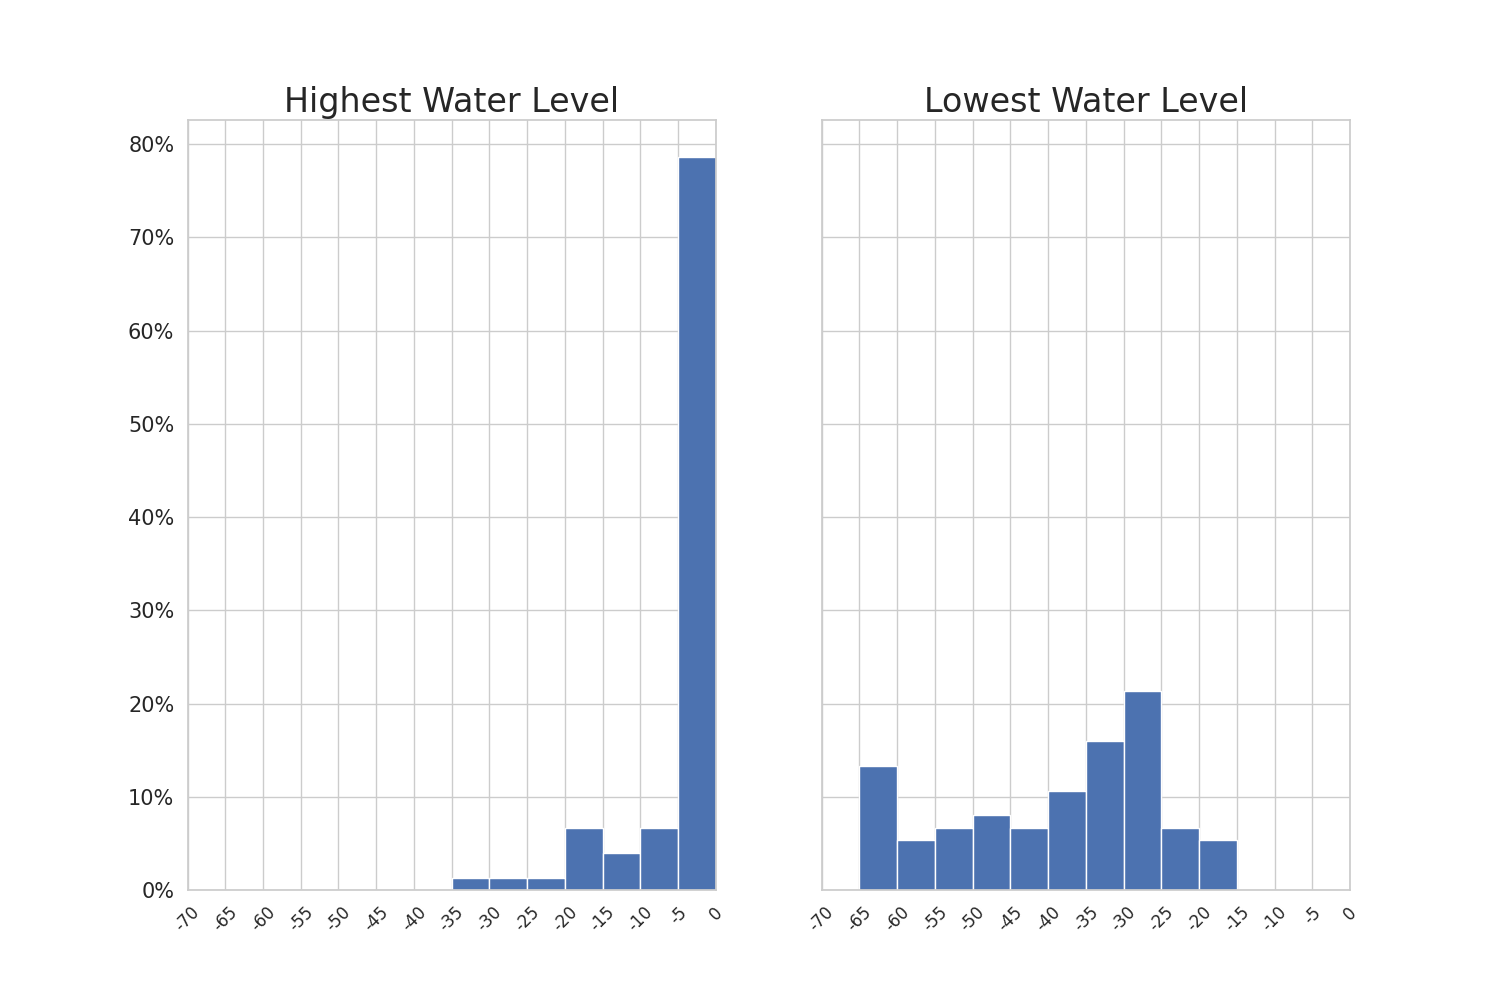
Frequency: Highest and Lowest Levels
How to read this chart
- These charts are histograms of the lowest and highest levels for each year.
- For instance, the highest level is usually 5 feet down or higher. In other words, most of the time the lake gets pretty close to full.
- Not surprisingly, the lowest level has a much wider distribution. Almost 10% of the time it is over 60 feet down. But over 30%% of the time it never gets less than 30 feet down. (Here I summed the percentages in the last theree columns of the second chart.)
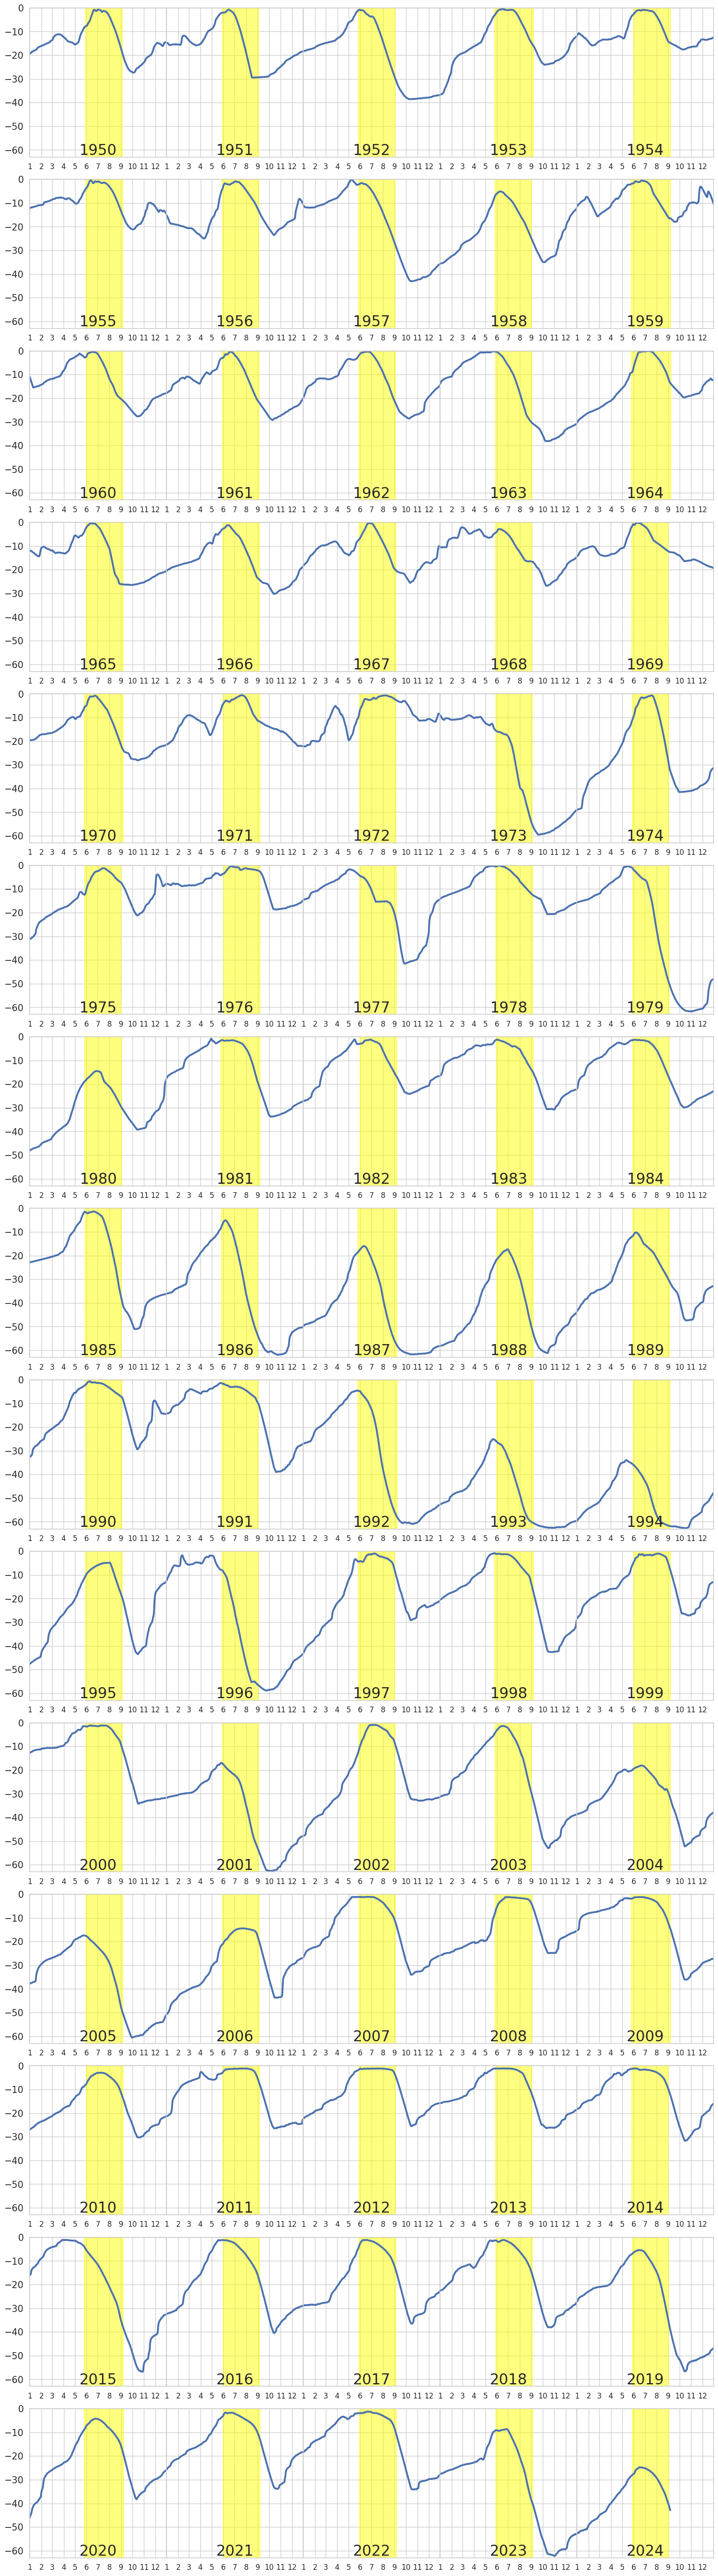
Feetdown Per Year
Yellow is Summer - Memorial Day to Labor Day
How to read this chart
- This shows the full data over the full range, yearly.
- The yellow is summer - Memorial Day to Labor Day
- Y-axis is feetdown
- X-axis is month: Jan (1) to Dec (12)