Lake Kachess Water Level
About
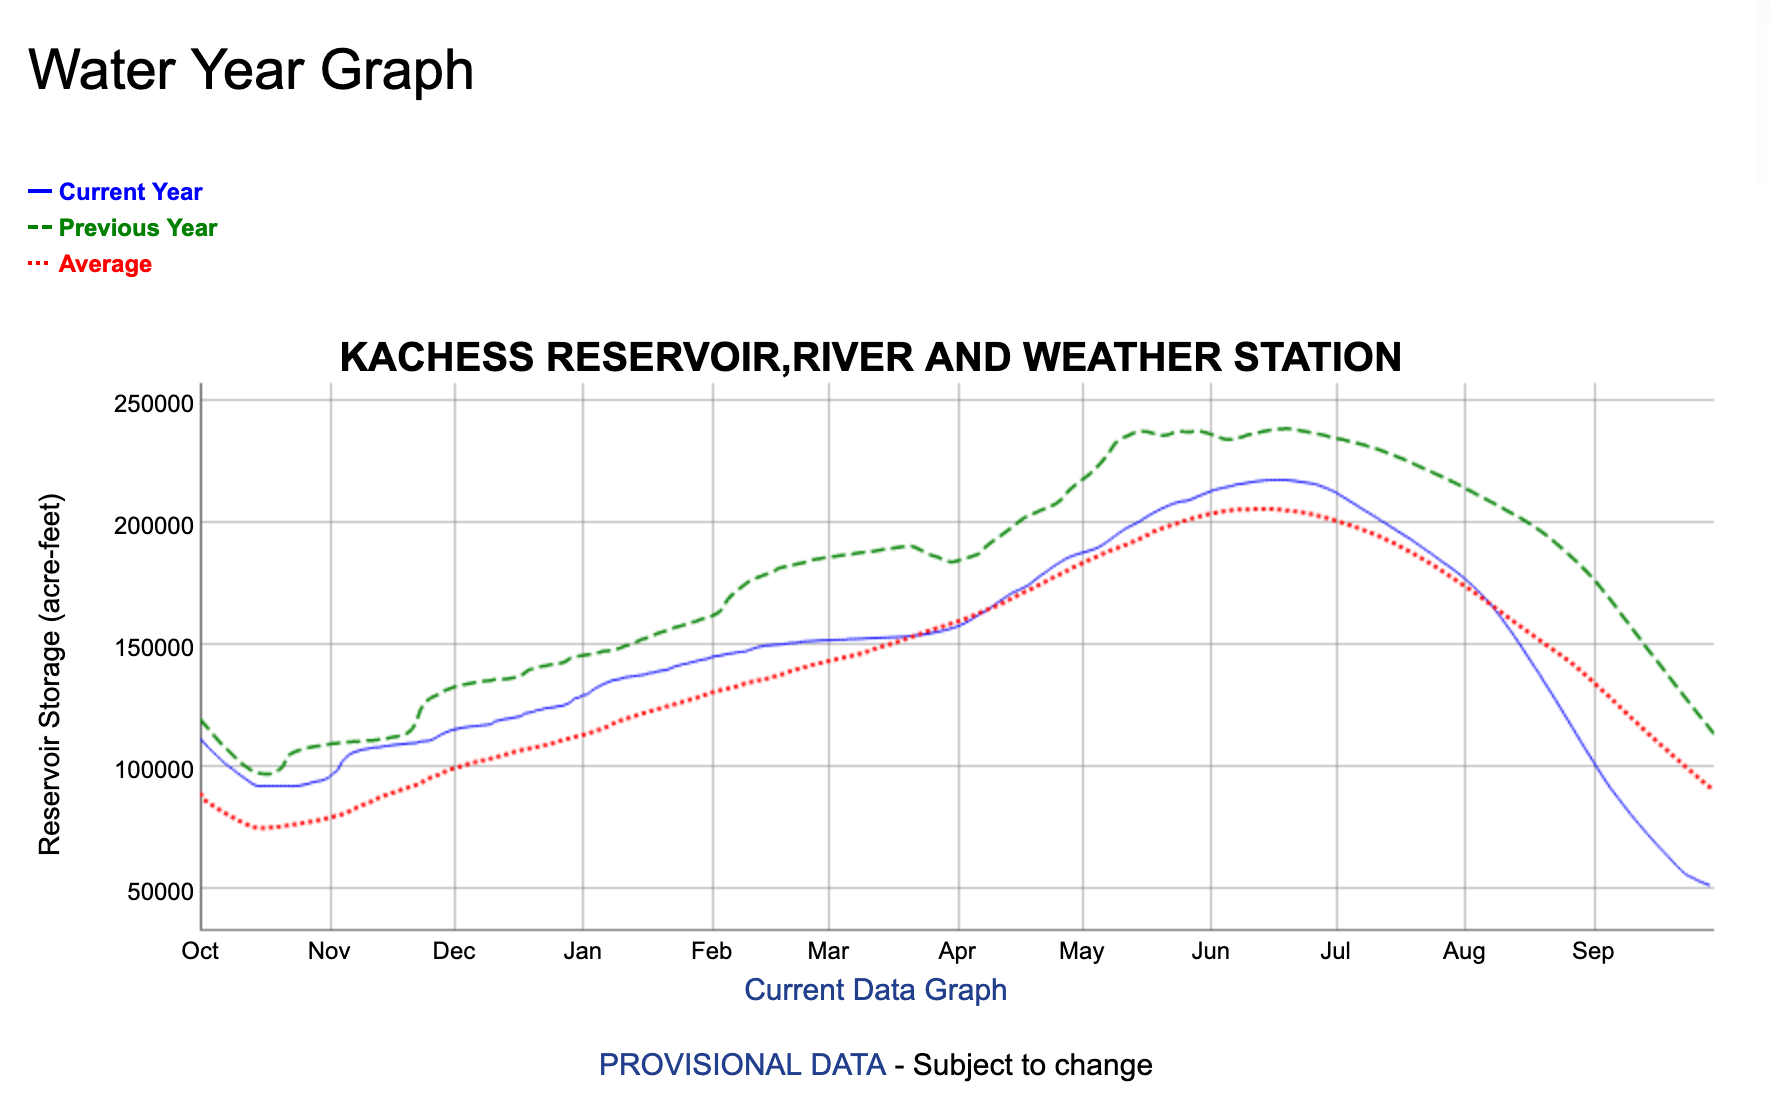
This data is taken from the U.S. Bureau of Reclamation. They have a decent chart showing the amount of water in Kachess reservoir here (and shown to the right). They have complete source data for download here.
Unfortunately it has a few deficiencies:
- Units - The chart shows the volume of water in the reservoir. As a recreational lake user, what I care about is how far it is below full.
- Context - The chart shows the average water level, but that averages good years and bad. What I care about is what type of year it is and where is it likely to go.
This mini website attempts to help answer those questions and give some insight into the lake level. It's almost certainly overkill analysis for what any normal person would care about, but I needed to refresh some technical skills, and this was an interesting data set to play with.
Data Sources
Regression
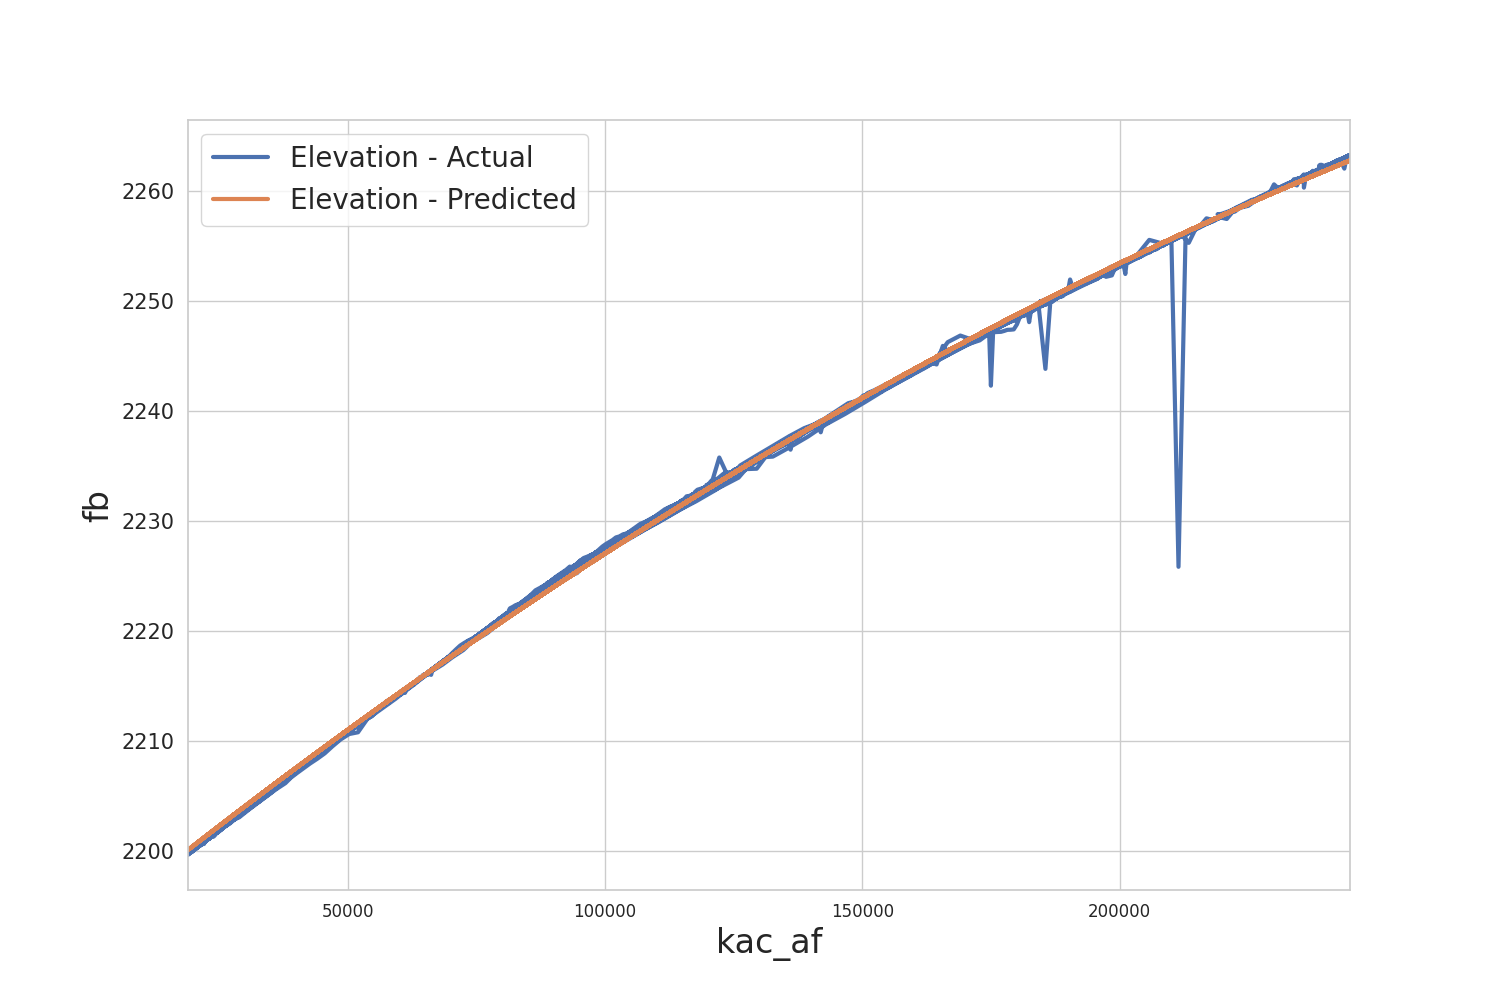
The USBR has a metric called "kac_fb" which is "Reservoir Surface Elevation, feet". This is almost exactly what we want. Unfortunately the data begins in 6/3/2017. So what I wanted to do is figure out the relationship between surface elevation and "kac_af" - Reservoir Water Storage (volume), which we have for the entire period.
A simple and accurate way to figure out this relationship is with a regression analysis. Explaining how that works is beyond the scope of this site, but for those who are interested, here are the results of that analysis.
The equation relating surface elevation to lake volume
kac_fb = 2,193 + 0.0004*kac_af + -0.00000000038*kac_af^2
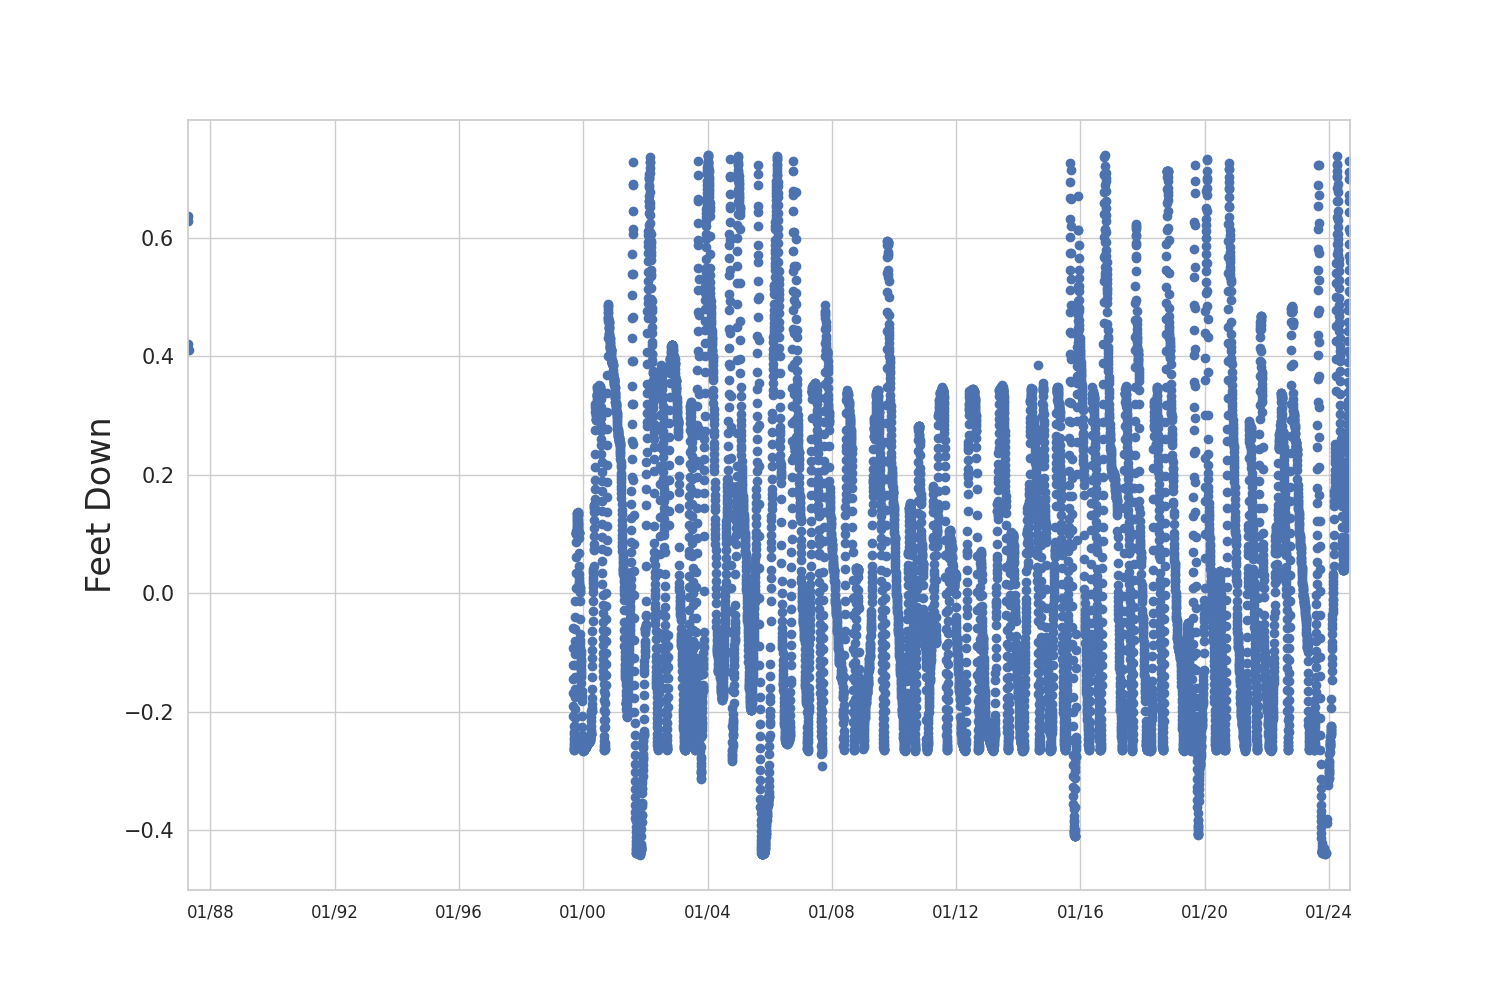
feetdown = -1 * (max(kac_fb) - kac_fb)
Regression Statistics
| Dep. Variable: | kac_fb | R-squared: | 1.000 |
|---|---|---|---|
| Model: | OLS | Adj. R-squared: | 1.000 |
| Method: | Least Squares | F-statistic: | 3.077e+07 |
| Date: | Sun, 02 Aug 2026 | Prob (F-statistic): | 0.00 |
| Time: | 12:00:18 | Log-Likelihood: | -9183.5 |
| No. Observations: | 27970 | AIC: | 1.837e+04 |
| Df Residuals: | 27967 | BIC: | 1.840e+04 |
| Df Model: | 2 | ||
| Covariance Type: | nonrobust |
| coef | std err | t | P>|t| | [0.025 | 0.975] | |
|---|---|---|---|---|---|---|
| const | 2192.9675 | 0.011 | 2.04e+05 | 0.000 | 2192.946 | 2192.989 |
| kac_af | 0.0004 | 1.58e-07 | 2398.371 | 0.000 | 0.000 | 0.000 |
| kac_af_squared | -3.821e-10 | 5.4e-13 | -707.255 | 0.000 | -3.83e-10 | -3.81e-10 |
| Omnibus: | 69187.381 | Durbin-Watson: | 0.629 |
|---|---|---|---|
| Prob(Omnibus): | 0.000 | Jarque-Bera (JB): | 6263893851.413 |
| Skew: | -25.773 | Prob(JB): | 0.00 |
| Kurtosis: | 2320.791 | Cond. No. | 1.78e+11 |
Notes:
[1] Standard Errors assume that the covariance matrix of the errors is correctly specified.
[2] The condition number is large, 1.78e+11. This might indicate that there are
strong multicollinearity or other numerical problems.
Regression Error: Actual vs. Predicted
Regression Error: Feet Down vs. Date
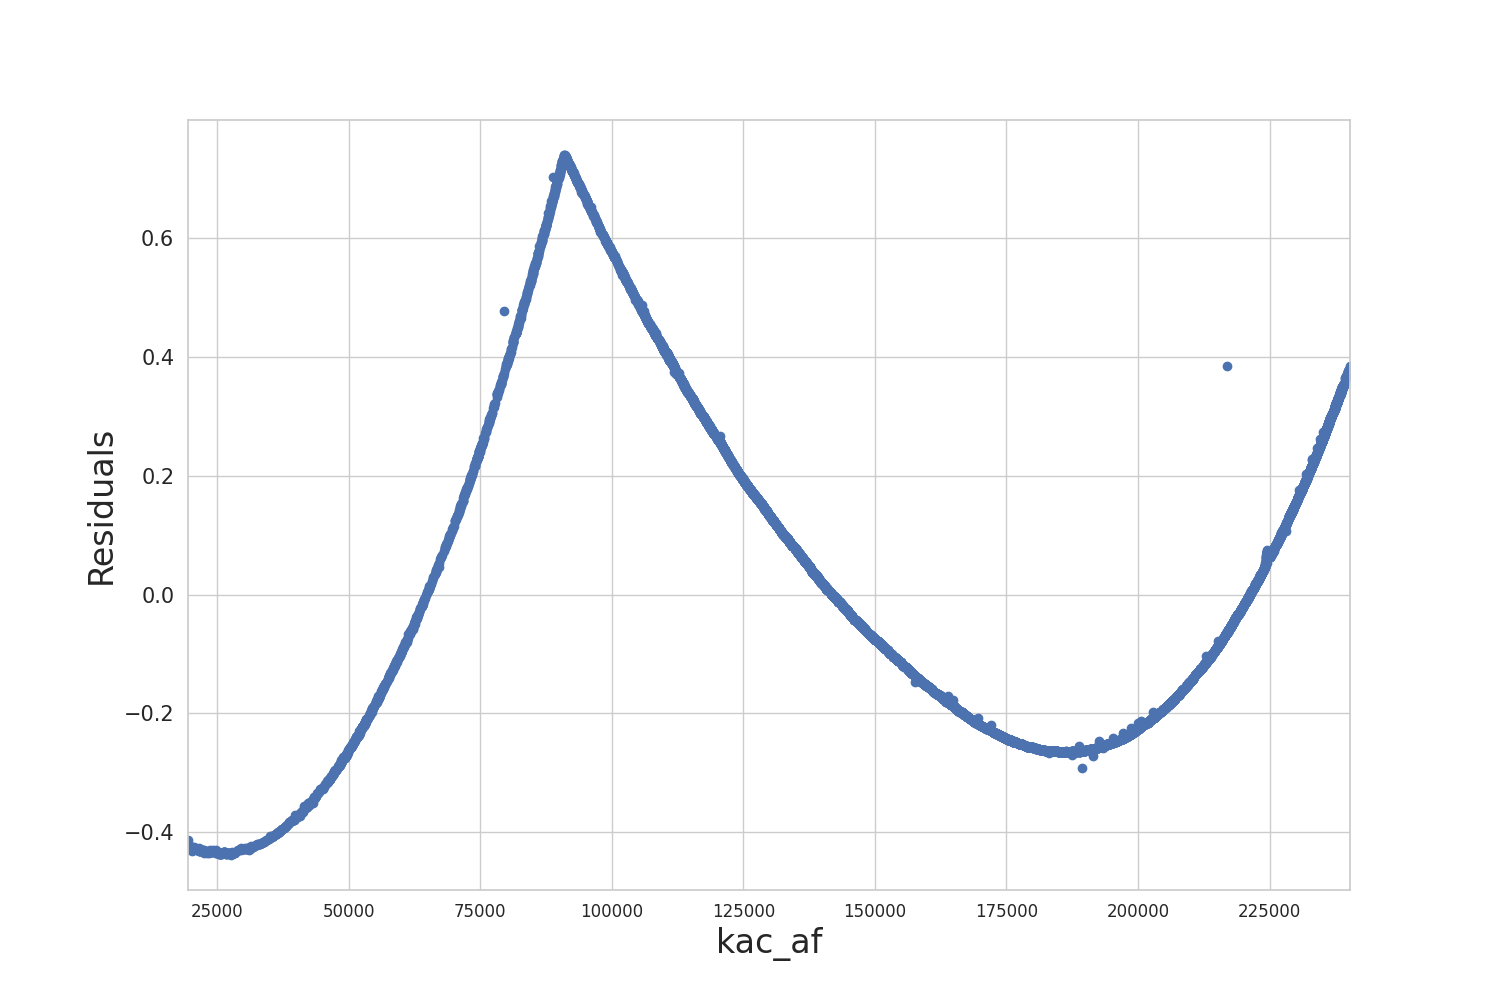
Regression Error: Residuals vs. kac_af
About the Raw Data
| Field | Description | Data Start | Data End | Number Records |
|---|---|---|---|---|
| kac_af | Reservoir Water Storage, acre-feet | 1/1/1950 | 8/1/2026 | 27,972 |
| kac_fb | Reservoir Water Surface Elevation, feet | 1/1/1950 | 8/1/2026 | 27,970 |
| fb_predict | Predicted surface elevation (Added) | 1/1/1950 | 8/1/2026 | 27,972 |
| fb_predict_err | Prediction error (Added) | 1/1/1950 | 8/1/2026 | 27,970 |
| feetdown | Feet down from maximum (Added) | 1/1/1950 | 8/1/2026 | 27,972 |
| kac_qu | Estimated Average Unregulated Flow, cfs | 1/1/1950 | 8/1/2026 | 27,970 |
| kac_qd | Average Stream Discharge, cfs | 1/1/1950 | 8/1/2026 | 27,972 |
| kac_mm | Average Air Temperature, degF | 4/1/1978 | 8/1/2026 | 11,108 |
| kac_pc | Cummulative Precipitation, inches | 5/31/1984 | 8/1/2026 | 15,322 |
| kac_pp | Daily Total Precipitation, inches | 1/1/1978 | 8/1/2026 | 17,724 |
Highest / Lowest Lake Levels Per Year
| Maximum Lake Level | Minimum Lake Level | |||||
|---|---|---|---|---|---|---|
| Year | Date | Feetdown (ft) | Volume (acre-feet) | Date | Feetdown | Volume |
| 1950 | 7/2/1950 | -0.7 | 240,890 | 10/4/1950 | -27.3 | 128,810 |
| 1951 | 6/15/1951 | -0.7 | 240,840 | 8/18/1951 | -29.5 | 121,320 |
| 1952 | 5/29/1952 | -0.8 | 240,710 | 10/10/1952 | -38.6 | 90,750 |
| 1953 | 6/18/1953 | -0.6 | 241,750 | 1/1/1953 | -36.7 | 96,810 |
| 1954 | 6/26/1954 | -0.8 | 240,340 | 10/11/1954 | -17.6 | 165,350 |
| 1955 | 6/13/1955 | -0.3 | 243,030 | 10/3/1955 | -21.1 | 151,750 |
| 1956 | 7/3/1956 | -0.8 | 240,340 | 4/10/1956 | -25.0 | 137,340 |
| 1957 | 5/9/1957 | -0.0 | 244,720 | 10/15/1957 | -43.1 | 76,450 |
| 1958 | 6/11/1958 | -5.1 | 219,440 | 1/1/1958 | -35.7 | 100,230 |
| 1959 | 6/23/1959 | -0.5 | 242,250 | 9/18/1959 | -17.9 | 164,050 |
| 1960 | 6/17/1960 | -0.4 | 242,800 | 10/15/1960 | -27.7 | 127,620 |
| 1961 | 6/19/1961 | -0.4 | 242,850 | 10/10/1961 | -29.2 | 122,140 |
| 1962 | 6/18/1962 | -0.3 | 243,120 | 10/9/1962 | -28.6 | 124,400 |
| 1963 | 5/23/1963 | -0.1 | 243,990 | 10/10/1963 | -38.1 | 92,170 |
| 1964 | 7/8/1964 | -0.0 | 244,580 | 1/1/1964 | -30.4 | 118,110 |
| 1965 | 6/14/1965 | -0.4 | 242,390 | 9/28/1965 | -26.5 | 132,000 |
| 1966 | 6/13/1966 | -1.2 | 238,440 | 10/14/1966 | -30.2 | 118,820 |
| 1967 | 6/26/1967 | -0.3 | 243,030 | 10/12/1967 | -25.6 | 135,160 |
| 1968 | 2/28/1968 | -2.1 | 234,230 | 10/11/1968 | -26.9 | 130,500 |
| 1969 | 6/10/1969 | -0.1 | 244,260 | 12/31/1969 | -19.4 | 158,500 |
| 1970 | 6/24/1970 | -0.8 | 240,660 | 10/15/1970 | -28.1 | 126,250 |
| 1971 | 7/20/1971 | -0.6 | 241,620 | 12/31/1971 | -22.2 | 147,810 |
| 1972 | 8/8/1972 | -0.7 | 241,220 | 1/6/1972 | -22.2 | 147,540 |
| 1973 | 1/1/1973 | -9.0 | 201,510 | 9/20/1973 | -59.6 | 27,810 |
| 1974 | 7/19/1974 | -0.7 | 241,210 | 1/1/1974 | -49.0 | 58,190 |
| 1975 | 7/16/1975 | -1.3 | 238,250 | 1/1/1975 | -31.1 | 115,600 |
| 1976 | 6/21/1976 | -0.4 | 242,800 | 10/21/1976 | -18.7 | 161,230 |
| 1977 | 5/4/1977 | -1.7 | 236,040 | 9/28/1977 | -41.5 | 81,330 |
| 1978 | 6/6/1978 | -0.0 | 244,672 | 10/13/1978 | -20.6 | 153,600 |
| 1979 | 5/16/1979 | -0.3 | 243,074 | 11/1/1979 | -61.8 | 21,651 |
| 1980 | 6/27/1980 | -14.4 | 178,295 | 1/1/1980 | -48.0 | 61,373 |
| 1981 | 4/30/1981 | -0.8 | 240,391 | 10/5/1981 | -33.7 | 106,662 |
| 1982 | 5/17/1982 | -1.1 | 239,127 | 1/1/1982 | -27.1 | 129,629 |
| 1983 | 6/1/1983 | -1.2 | 238,633 | 11/1/1983 | -30.7 | 116,980 |
| 1984 | 5/31/1984 | -1.3 | 238,212 | 10/13/1984 | -29.9 | 119,733 |
| 1985 | 6/20/1985 | -1.4 | 237,665 | 10/7/1985 | -51.1 | 52,190 |
| 1986 | 6/7/1986 | -5.1 | 219,489 | 10/25/1986 | -62.0 | 21,060 |
| 1987 | 6/11/1987 | -16.0 | 171,986 | 10/14/1987 | -61.7 | 21,700 |
| 1988 | 6/29/1988 | -17.3 | 166,492 | 10/13/1988 | -61.2 | 23,280 |
| 1989 | 6/6/1989 | -10.2 | 196,213 | 10/18/1989 | -47.4 | 63,190 |
| 1990 | 6/10/1990 | -0.7 | 241,342 | 1/1/1990 | -32.6 | 110,608 |
| 1991 | 5/24/1991 | -1.4 | 237,755 | 10/20/1991 | -39.0 | 89,260 |
| 1992 | 5/21/1992 | -4.6 | 221,750 | 10/19/1992 | -60.9 | 24,030 |
| 1993 | 5/22/1993 | -25.1 | 136,910 | 10/31/1993 | -62.6 | 19,360 |
| 1994 | 5/13/1994 | -33.9 | 106,040 | 10/18/1994 | -62.8 | 18,920 |
| 1995 | 8/2/1995 | -4.8 | 220,640 | 1/1/1995 | -47.6 | 62,420 |
| 1996 | 2/12/1996 | -1.7 | 235,945 | 9/24/1996 | -58.9 | 29,750 |
| 1997 | 7/10/1997 | -0.9 | 239,935 | 1/1/1997 | -43.1 | 76,320 |
| 1998 | 5/25/1998 | -0.8 | 240,754 | 10/22/1998 | -42.6 | 77,902 |
| 1999 | 8/4/1999 | -1.0 | 239,567 | 1/1/1999 | -28.5 | 124,661 |
| 2000 | 7/10/2000 | -1.1 | 238,935 | 10/17/2000 | -34.2 | 105,120 |
| 2001 | 5/27/2001 | -17.0 | 168,009 | 10/10/2001 | -62.6 | 19,355 |
| 2002 | 7/7/2002 | -0.9 | 240,295 | 1/1/2002 | -47.7 | 62,150 |
| 2003 | 6/18/2003 | -1.4 | 237,710 | 10/16/2003 | -53.0 | 46,396 |
| 2004 | 6/22/2004 | -18.1 | 163,570 | 10/15/2004 | -52.3 | 48,646 |
| 2005 | 5/25/2005 | -17.4 | 166,330 | 9/30/2005 | -60.6 | 24,788 |
| 2006 | 7/22/2006 | -14.4 | 178,380 | 1/1/2006 | -50.7 | 53,138 |
| 2007 | 6/19/2007 | -1.1 | 239,070 | 10/15/2007 | -34.0 | 105,760 |
| 2008 | 7/3/2008 | -1.2 | 238,620 | 1/1/2008 | -25.8 | 134,334 |
| 2009 | 6/20/2009 | -1.2 | 238,620 | 10/16/2009 | -36.1 | 98,840 |
| 2010 | 7/11/2010 | -2.9 | 229,870 | 10/19/2010 | -30.3 | 118,549 |
| 2011 | 7/25/2011 | -1.1 | 238,800 | 10/17/2011 | -26.4 | 132,114 |
| 2012 | 7/8/2012 | -1.2 | 238,710 | 10/15/2012 | -25.5 | 135,314 |
| 2013 | 6/20/2013 | -1.1 | 238,935 | 10/11/2013 | -26.4 | 132,342 |
| 2014 | 6/2/2014 | -1.2 | 238,755 | 10/16/2014 | -31.7 | 113,607 |
| 2015 | 4/6/2015 | -1.1 | 238,845 | 10/29/2015 | -56.8 | 35,576 |
| 2016 | 5/19/2016 | -1.1 | 238,845 | 10/14/2016 | -40.5 | 84,532 |
| 2017 | 6/15/2017 | -1.1 | 238,890 | 10/17/2017 | -36.6 | 97,300 |
| 2018 | 6/19/2018 | -1.1 | 238,845 | 10/15/2018 | -38.1 | 92,428 |
| 2019 | 6/17/2019 | -5.4 | 217,852 | 10/15/2019 | -56.7 | 35,772 |
| 2020 | 6/25/2020 | -4.2 | 223,620 | 1/1/2020 | -46.0 | 67,417 |
| 2021 | 6/7/2021 | -1.6 | 236,350 | 10/21/2021 | -33.9 | 106,293 |
| 2022 | 6/20/2022 | -1.2 | 238,439 | 10/23/2022 | -34.1 | 105,366 |
| 2023 | 6/27/2023 | -8.7 | 203,026 | 11/1/2023 | -62.2 | 20,391 |
| 2024 | 6/16/2024 | -24.8 | 138,098 | 10/19/2024 | -59.7 | 27,354 |
| 2025 | 6/24/2025 | -19.8 | 156,740 | 10/25/2025 | -61.7 | 21,889 |
| 2026 | 5/25/2026 | -6.2 | 214,420 | 1/1/2026 | -32.2 | 111,760 |