Lake Kachess Water Level
Cohort Analysis
What will likely happen based on days similar to today?
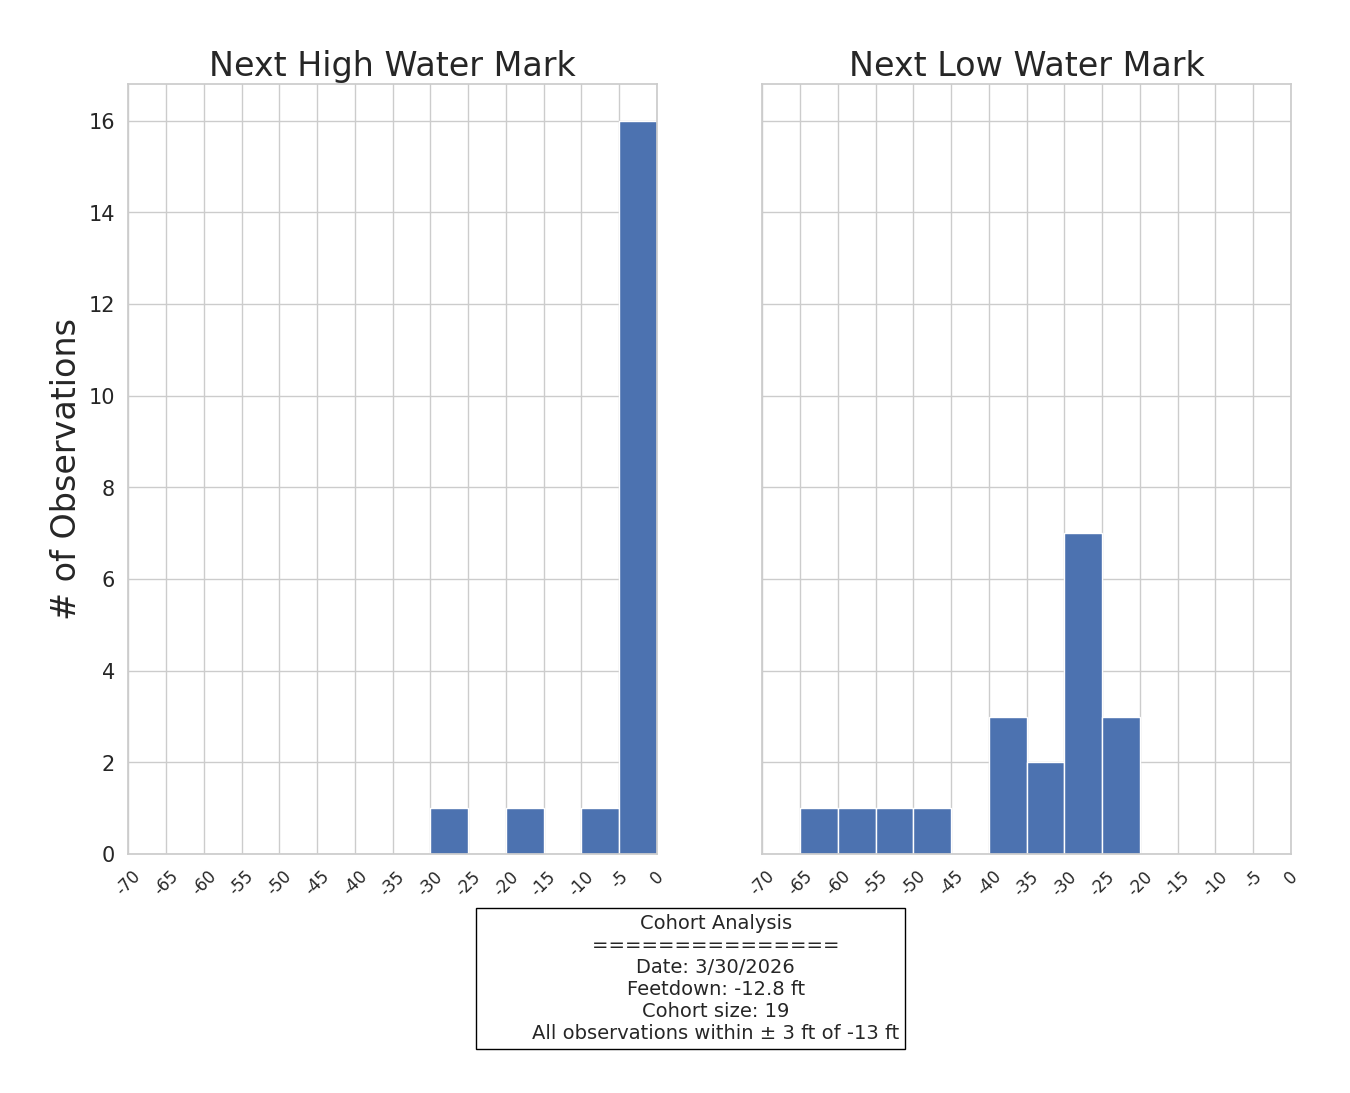
How to read this chart
This one is a bit complicated! It attempts to give you an idea of what you can expect for next season, given what you see today. But it is far from perfect!
How it works
- Start with the last date we have data for.
- Then find all the observations (data points) that are close to it.
- What is close?
- Start with all observations with +/- 3 feet
- If you get 10 observations, you're done.
- If not, keep increasing the distance until you get 10 observations.
- If you get to +/- 10 feet, stop anyway.
How to think about it
Basically, you find all the historical dates that are like today. Then you look forward and see what the next high and low water mark for those dates. Start with observations very close to today (+/- 3 feet). But keep expanding to get 10 observations since if you only have a few observations, it doesn't tell you much. On the other hand, as the range gets bigger, the other observations become less like today. So it's a trade off.
For some dates, this may give you good insight. But for the very unusual ones, it will likely be less helpful.
How Much Shoreline is Exposed?
How to read this chart
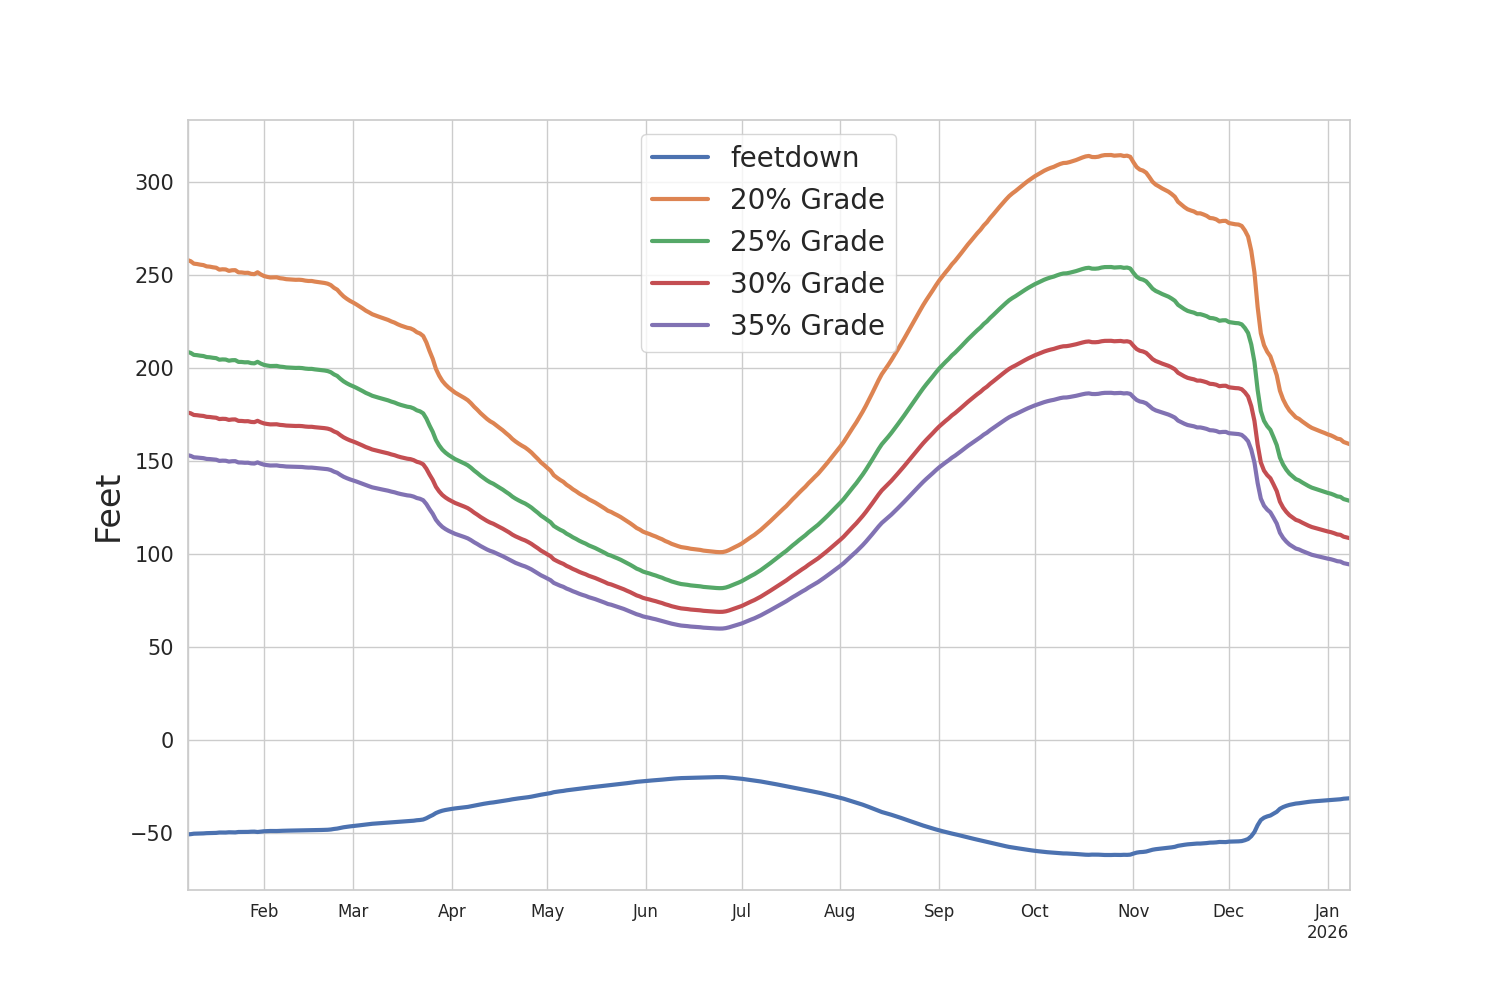
This tries to give you an idea of the exposed shoreline, based on the approximate steepness (grade) of the shore near you.
Note the y-axis is a bit screwy. "Feetdown" is the number of feet down from maximum, which I measure in negative numbers. The exposed shoreline is positive. So the more "feetdown" in a negative direction, the more shoreline, in a positive one!
- The grade of a hill can be defined as:
grade = rise / run
- So if you have a rise of 1 foot and a run of 4 feet, that is a 25% grade. (A 45° angle is a 100% grade.)
- In the part of the shoreline I care about, I have a 27% grade.
- It's easy to calculate the grade of a slope. You need a 4 foot level and a tape measure. Find a representative part of the hill. Put one edge of the level on the hill, and the other sticking out until it is level. Then measure the height from the bottom of the level to the slope. Then:
percent grade = (measured height)
/ 48 (the length of the 4 ft level) - In case you are wondering about the horizontal distance, say to a mooring or dock, it turns out that is almost the same as the exposed shoreline / hypoteneuse. The angles are so low here that there isn't much of a difference.
How Much Does The Shoreline Change Each Day??
How to read this chart
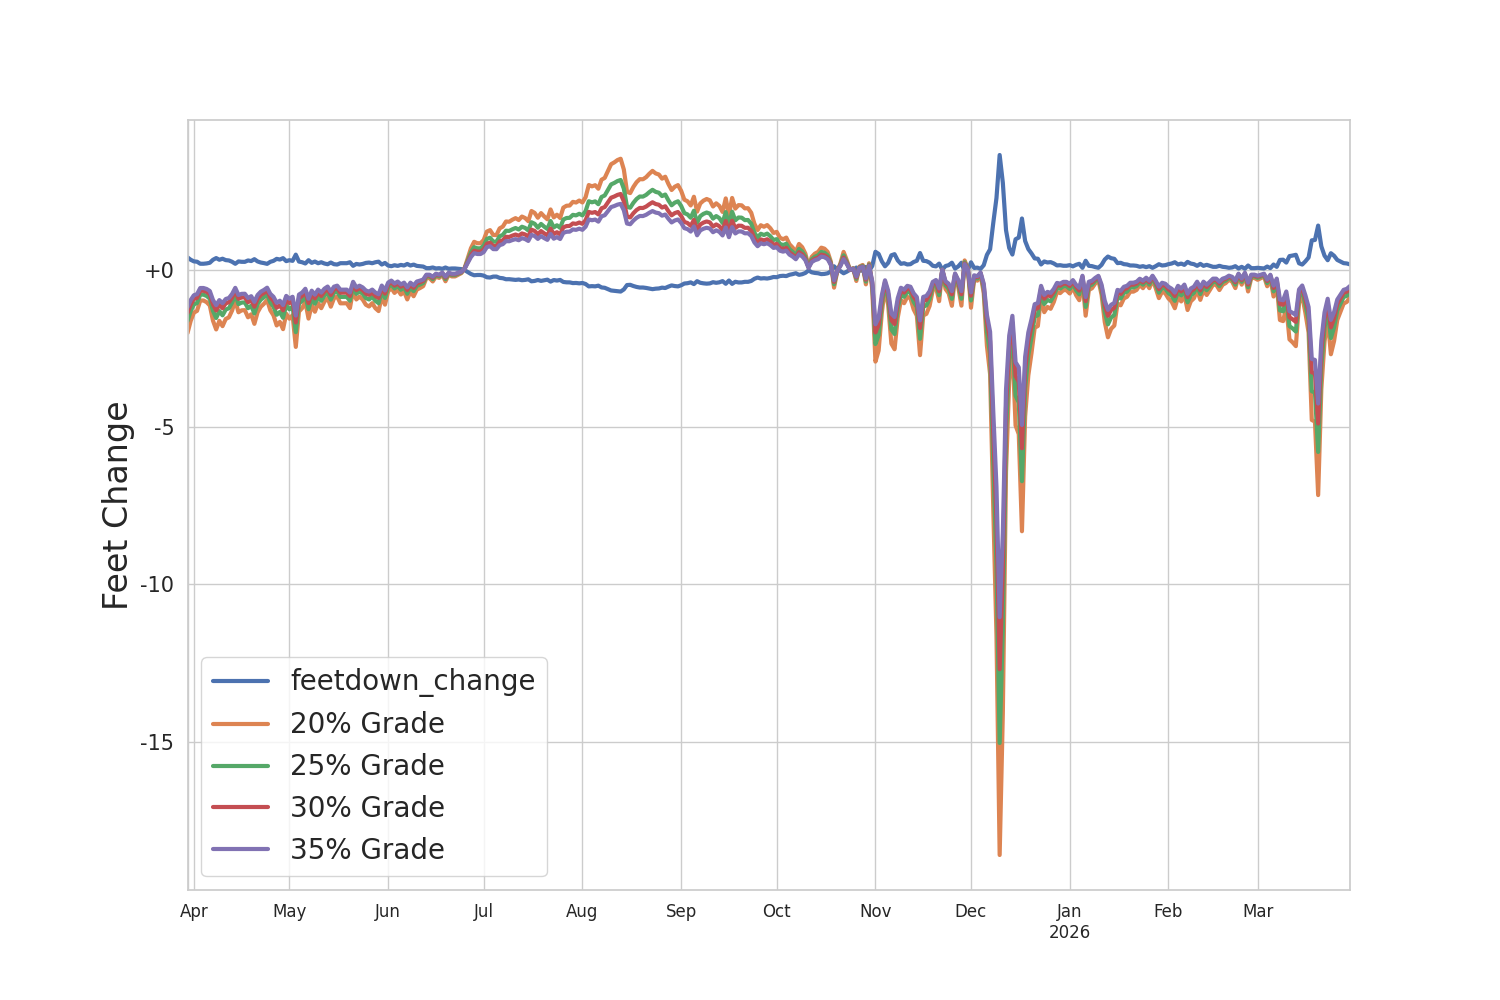
This is similar to the above chart but shows the rate of change. So at its fastest, the shoreline might increase 4 feet in a day!
Note the y-axis is a bit screwy. "Feetdown" is the number of feet down from maximum, which I measure in negative numbers. The exposed shoreline is positive. So the more "feetdown" in a negative direction, the more shoreline, in a positive one!